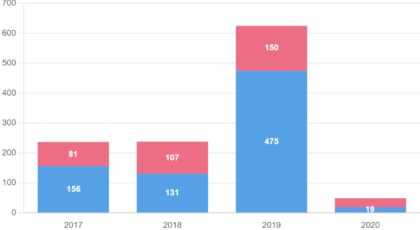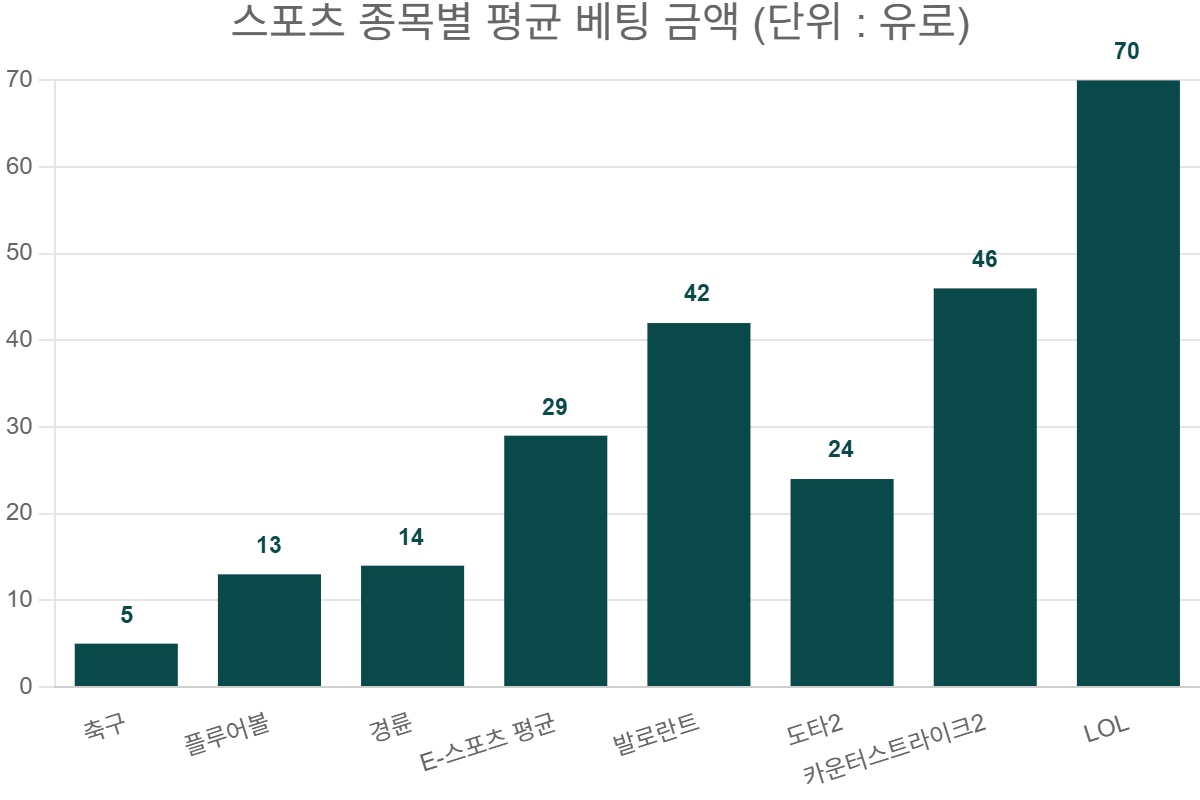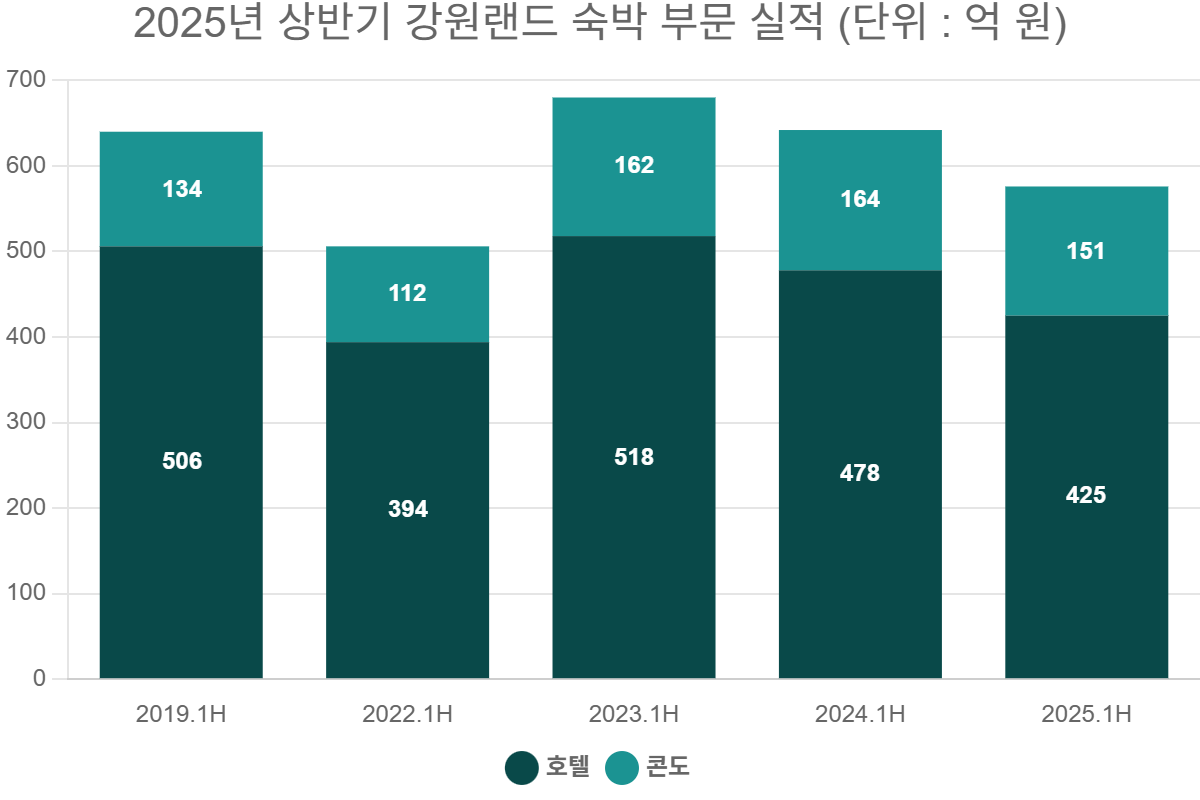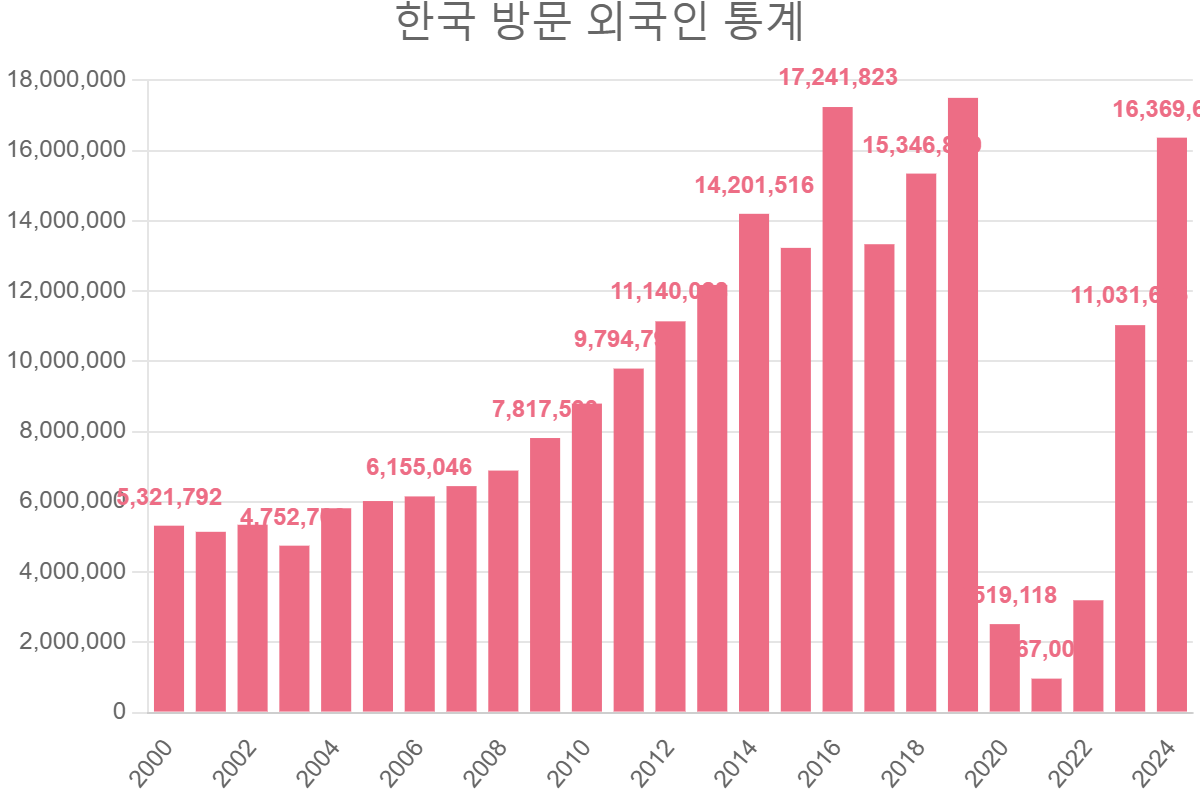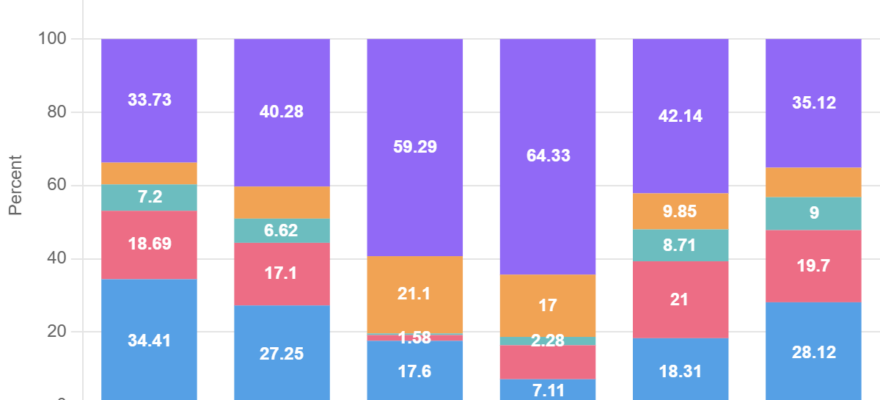
Stacked Column chart. Data table with 6 rows and 7 columns follows.
| 2019 | 2020 | 2021 | 2022 | 2023 | 2024 | |
|---|---|---|---|---|---|---|
| 중국 | 34.41% | 27.25% | 17.6% | 7.11% | 18.31% | 28.12% |
| 일본 | 18.69% | 17.1% | 1.58% | 9.28% | 21% | 19.7% |
| 대만 | 7.2% | 6.62% | 0.43% | 2.28% | 8.71% | 9% |
| 미국 | 5.96% | 8.75% | 21.1% | 17% | 9.85% | 8.06% |
| 기타 | 33.73% | 40.28% | 59.29% | 64.33% | 42.14% | 35.12% |